Bitcoin Price Plunge to $1,000 is Possible, Say Traders; Could it Happen?
Companies, agencies, institutions, etc
Bitcoin
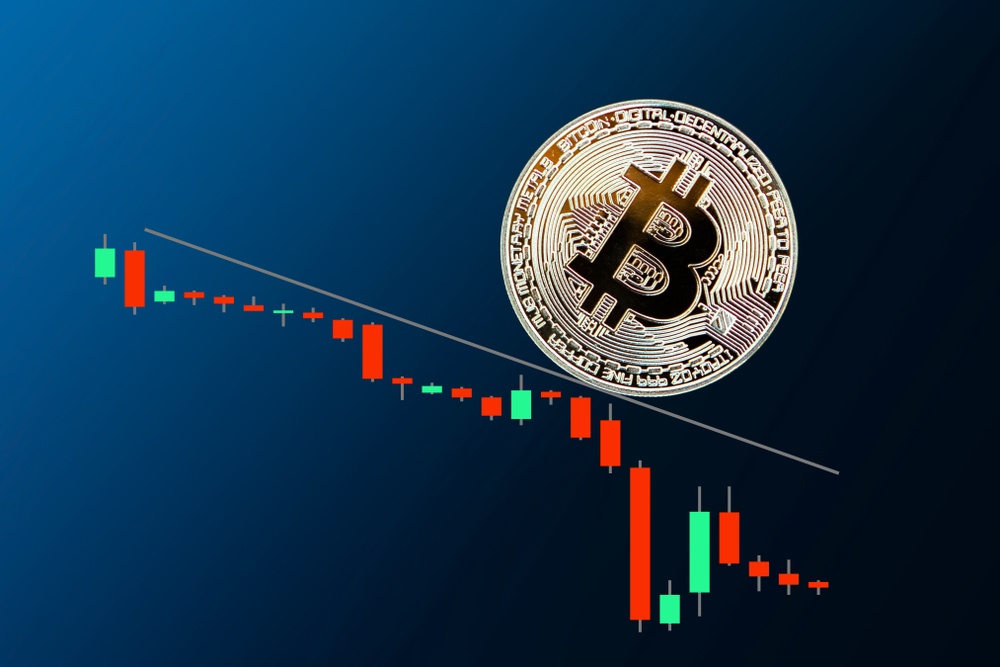
Bitcoin 2-Year Chart
BTC
the New York Stock Exchange
ICE
Bakkt
Morgan Creek
CCN
Cryptocurrency Analyst
Hacked
People
Hsaka
OaclTNLynl— Hsaka
2019Previously
Jeff Sprecher
Alex Krüger
Groups
No matching tags
Physical locations
No matching tags
Places
No matching tags
Locations
@Sawcruhteez
U.S.
Hong Kong
Events
No matching tags
Summary
Since January, for over two months, Bitcoin has remained in a relatively tight price range from $3,200 to $4,000, unable to break out of key resistance levels above $4,200.Similarly, from September to November, in an identical time frame, Bitcoin maintained low volatility in the $6,100 to $6,700 range.Bitcoin 2-Year Chart (Source: Coinmarketcap.com)The last time the dominant cryptocurrency showed an extended period of stability, it dropped from the $6,000 region to $3,122, by nearly half.Some traders have suggested that BTC could become vulnerable to a similar downside movement in the near-term if it fails to demonstrate momentum.Historical performance is not a guarantee of an asset’s future performance and as such, it has to be only cited as a reference.In late 2018, Bitcoin did show weakness after falling from $6,000 to $3,122 in a short time frame following two months of low volatility.But, during that period, the sentiment around cryptocurrencies as an asset class was on the decline and investors were still recovering from the intense 85 percent correction of the crypto market.The longer we stay stuck in this range the more I feel like we will mirror the price action from September 20, 2018 – November 25, 2018.
As said here by Joseph Young